|
Ray Tomes' - Harmonics Theory - The Physics and Maths
This page discusses the fundamentals of physics in layman's terms, showing how present theory must inevitably lead to all waves losing energy and forming harmonically related waves, the end result is a very specific detailed structure that matches the observed universe and explains many previously mysterious observations. A large screen resolution is recommended to see the graphics clearly. This page has many graphics and may take a while to load. |
| Universal Waves |
Maxwell developed his famous equations for electromagnetism around 1870 and showed that not only electricty and magnetism behaved according to wave equations, but that interactions of the two also behaved as waves that travelled at the speed of light and produced the phenomena known as light, later found to include waves from long radio waves down to very short gamma ray waves. Since then, major discoveries in fundamental physics have been dominated by the wave nature of all things, as shown by Einstein, Schroedinger, de Broglie and many others.
Although the diverse phenomena modelled by the various physics equations have not yet been brought into the sphere of a single model, there are enough clues to say that such a model ought to be possible. It is natural that such a model would include a wave equation, and the universe is essentially a wave phenomenon.
Often when people think about waves they only think about travelling waves, the type that happen when you drop a stone into a calm pond, a series of concentric waves travelling out from a central disturbance, all the time getting weaker through spreading over a larger circumference. There is another type of wave also, called a standing wave, an example of which is a vibrating guitar string or a beaten drum. In these types of waves the energy is mostly constrained from leaving a limited region and so wrap back on themselves producing a wave that oscillates in place.
The question of whether the universe is finite or not is generally considered to still be open. When cosmologists mention the "size of the universe" they are generally referring to a parameter related to the distance to a horizon beyond which we cannot see. However in present models of the universe there is nothing to prevent the actual size being much greater. If the universe has a finite size then it can support standing waves which fit evenly into that size in much the same way that a guitar can. Even if it is not finite, there may be characteristic wave sizes that form as a result of the prevailing conditions, much as waves form in the wide ocean.
There are many reports of regular spacings in "things", ranging from nucleons and atoms through to planets, galaxies and even galactic clusters. This regularity is evidence for waves underlying things. The reason for "things" being in quotes is that once the wave nature of all things is properly understood it is found that there are in fact no such things as things. There are only waves and processes. When we watch the surf, we see waves come travelling in and hitting the shore to fall away and die. However the wave is not a thing, it is a trick of mind following the eye, seeing a process of adjacent regions rising and falling as a moving thing when in fact no thing actually does that motion that we see as a wave.
Similarly when we watch TV we see images of people moving about on the screen, but actually they do not move, they are constantly reconstructed by electrons hitting the screen. Even my explanation in terms of this thing called the electron is equally wrong because the moving electron is also an illusion of energy arriving at adjacent locations in a stream that makes the appearance of a thing. This is the essential nature of matter that wave energy arrives wave after wave at a central location which may even be moving, and after passing through the centre travels out again as the other half of the standing wave that makes it seem like a thing wobbling in place.
| Waves of Matter |
The mathematician and physicist, William Clifford, suggested that matter was an electromagnetic standing wave form very soon after Maxwell produced his equations, and de Broglie showed the essential wave nature of matter followed from Einstein's and Schroedinger's equations, making predictions that were correct. Eventually whole atoms were passed through a version of Youngs two slit experiment and showed the characteristic interference pattern of waves. There is no doubt that matter has a wave nature, although sometimes it is described as also having a particle nature. We shall see that particle nature is really the fact that the standing wave has a definite centre.
Next, Wheeler and Feynman came very close to realising that the electron wasn't just something that manifested waves, but was nothing other than this wave. They arrived at an understanding of the incoming and outgoing waves and the standing wave formed by these. However they could not fully accept the mysterious incoming wave - how did it know where to arrive and to produce this tight centre that we know as an electron? The mystery entirely vanishes when it is fully understood that the electron is the wave and nothing else. The wave does not need to know where the electron is, as wherever the wave converges that "is" the electron. The forces of nature are to be understood as those events that cause the place of convergence to move in various ways.
Although physicists accept the wave nature of matter, some still seem to hang on to ideas that there is something other than waves while others seem quite content in the wave nature. Perhaps the confusion for some is caused by the pesky particle nature and this duality that is often mentioned. In essence, a "particle" is a standing wave that has a definite centre where the concentration of the energy is greatest and which may move about and interact with other such "particles". Each different type of particle has its own characteristic wavelength and energy.
That wasn't so difficult to digest, but when it comes to light, the "particle" behaviour is more difficult to fathom. In essence, when light is emmitted by an atom due to a rearrangement in the structure of an electron relative to the nucleus, the change in energy of the atom is quite discrete. Therefore the light has a particular wavelength related to that energy. A similar thing is observed if different sized stones are dropped in the pond, or a single stone from different heights.
The light wave created by this atomic event then spreads out over the universe just like the ripples in the pond, eventually getting all but lost in the background ripples that exist everywhere in the electromagnetic field. However at some other place, this ripple may combine with a fortuitous combination of background energy to cause an exact reverse of the atomic event that started the ripple. This absorption is of about the same amount of energy as the earlier emission event and is causally related to it through the ripple. However it would be a wrong description to say that a "photon" of light travelled between one atom and another. The electromagnetic field is continuous not discrete. The discreteness only exists in the possible energy levels of atomic and nuclear configurations.
| Non-linearity of Waves |
When Maxwell produced his equations they were what is called linear equations. This means that when one wave and another meet they can travel right through each other without any interaction, just as if the other wave was not there. This is a necessary condition for light because if we look at the Moon, we are not obstructed in seeing it by the light of the Sun travelling across the path that we look through. So the linearity of light's behaviour is acceptable for this reason.
However light does some other things that are quite different. Firstly, we can see it. That proves that it didn't just pass through our eye without interacting, it quite clearly did interact. In fact we know that most solid things obstruct light completely, or at the very least refract it. We can add to this behaviour that Einstein correctly predicted from General Relativity that light is bent by gravity, and twice as much as is expected by Newton's theory.
Einstein's result gives us a big clue, because it shows that gravitation, a very weak force compared to the charge forces that hold matter together, can affect light if there is a big enough concentration of matter, even totally trapping light in the extreme limit of a black hole.
Although physicists refer to Einstein's equations as bending space, they do not do the same thing with respect to the refraction of light by matter such as glass. It is unreasonable to refer to light that is refracted in different substances as being a change in velocity while referring to the bending of light by massive objects as a change in the metric of space. These two behaviours should be seen as different aspects of the same thing. Different to be sure, because the one case is due to gravity and the other due to charge forces.
These interactions show quite clearly that in the presence of matter light is behaving as if it is non-linear. Perhaps it is the case that light is always really non-linear, but that under common circumstances the non-linearity is so slight as to go unnoticed. In fact, experiments with powerful lasers confirm that very concentrated light can interact with itself without the presence of matter.
This is a very important conclusion, because it is only possible for light and matter to be united in being made of the same stuff if that stuff allows both the interactions and the apparent non-interactions that we observe. Light, and Maxwell's electromagnetic equations are non-linear. This is true even though some physicists have been taught otherwise. It is true in general relativity, because the equations show that energy, be it matter or light, affects the metric or warping of space. This accepted conclusion that Maxwell's equations under general relativity form a non-linear system is very important for understanding the behaviour of the universe.
| Speed of light |
In general relativity, the speed of light is considered constant, but the amount of space in a region may be different from what one expects, somewhat in the manner of Dr Who's telephone box, with more space on the inside than there really ought to be. However, as mentioned earlier this same explanation is not used for the refraction of light in glass where it is quite happily admitted that the speed of light varies rather than saying that the glass is bigger on the inside than the outside.
It is possible to rephrase general relativity so that space is euclidean and the velocity of light varies. Such an approach is much easier on the mind as humans seem to be almost preprogrammed with the concepts of euclidean space.
When the wave equation was discussed comparisons were made to guitars and drums. In general, wave equations have the property that something is distorted and then "tries" to return to its original shape and in the process overshoots and ends up vibrating for a period. Clearly the possibilities in three dimensional space are much greater than in a one dimensional guitar string or two dimensional drum.
Even in these lesser dimensions, if the plucking or beating is very hard then that action may actually tighten the string or membrane, resulting in more tension and a slightly faster wave velocity. Such action will cause an instrument to be slightly higher in note although as the vibration dies down it will return to normal. Understanding that matter is very concentrated electromagnetic energy and that massive objects have great gravity, it is reasonable to also expect the presence of such "things" will cause a change in light velocity consistent with the alternative interpretation of general relativity and the behaviour of light in matter.
This variation of light wave speed with changes in the tension of the electromagnetic medium due to high concentrations of energy is the non-linearity that was mentioned and concludes the preparations for understanding a whole series of behaviours of the universe that were not previously realised.
Actually it is not necessary for physicists to change their view as suggested above in order to understand what follows, but it does make things easier on the mind. It is accepted that Einstein's general relativity does make Maxwell's equations into a non-linear system. That is sufficient.
| Non-linear Waves make Harmonics |
In any non-linear system waves will develop harmonics. This means that wave shapes gradually change over time. An example of this is when ocean waves approach the shore the wave velocity changes with changing depth and so the peaks of waves begin to catch up to the troughs, eventually breaking.
Consider a standing wave that fills the entire universe or, if you think the universe is infinite, then consider a large wave that satisfies some characteristic conditions of the universe. If the wave equation for the universe were linear, then such a wave would carry on wobbling in place for ever, never interacting with itself. However as the wave equation is non-linear the wave must change shape over time. For example, this changing in shape might be to have a sharper peak and flatter trough.
In presently accepted cosmology there may not be sufficient time in the universe for very large waves to develop in shape due to non-linearities. However the indication is that the measured parameters of such models show an acceleration parameter, which is another way of saying that the past may have been much longer than the initial indications. For the purpose of what follows the assumption will be made that there is no difficulty with large universal waves existing for very many cycles, which means that very particular values of cosmological parameters are necessary.
When a wave has a shape different from a sine wave then it is said that harmonics are present. Real musical instruments also have this property as when we pluck a guitar string it makes waves that fit not just one wave in the string, but also other waves that fit two, three, four and more waves exactly into the string. These other waves will always divide the original wave by an integer, and in the linear situation will have frequencies which are exact multiples of the fundamental wave.
The three dimensional universe is no different in this respect, the fundamental wave will have harmonics which are exact divisions of the wavelength, and if the non-linearity is not too great, multiples of the original frequency. However something additional happens in three dimensional standing waves that does not happen in the one dimensional case of the guitar. By the interaction of the three dimensions, these new waves also become standing waves and through the non-linearity also produce harmonics. This production of further harmonics by the harmonics is something that has not previously been investigated. Be ready for some entirely new understanding of the nature of waves in the universe.
| Many Harmonics |
Based on the present understanding of physics the universe may support large standing waves and because of the non-linearity of the wave equation we know that every wave will produce harmonics and in three dimensions these waves will also be standing waves. Taking a brave step from the correct understanding of the work of Wheeler and Feynman the assumption is that there is nothing but these waves. So forgetting all other known physics we state a single principle:
| The Universe consists of a standing wave which develops harmonically related standing waves and each of these does the same. |
From this simple principle the pattern of frequencies of the waves formed in the universe can be calculated. For the following calculations the assumption is that there initially exists a single frequency of a universal wave and that frequency will be called 1. We do not need to know 1 what to do the calculations, but it might be 1 cycle per period of about 14 billion years if that helps people to have some idea in their minds. When frequencies of 2 and 3 and other numbers are mentioned that will mean 2 or 3 or more cycles in 14 billion years. Here is a first look at this process of harmonic generation.
1 --> 2 3 4 5 6 7 8 9 10 11 12 13 14 15 16 ... 2 --> 4 6 8 10 12 14 16 3 --> 6 9 12 15 4 --> 8 12 16 5 --> 10 15 6 --> 12 7 --> 14 8 --> 16 ...etc |
This table shows that some harmonics are formed in multiple different ways, while others are formed in only one way. We may look at the 12th harmonic compared to the 11th and 13th. If a harmonic is formed in more ways then, assuming that the energy from each path is equal, it should have more energy in that wave. The situation is actually more extreme than it at first appears, because some of the harmonics going into the 12th harmonic already occurred in multiple ways and so each supplied multiple doses of energy. Altogether the 12th harmonic may be produced in 8 ways which are 12, 6x2, 2x6, 4x3, 3x4, 2x2x3, 2x3x2, 3x2x2. Each of these ways may supply a flow of energy equal to the 11th or 13th harmonic on its own.
To make this strictly true it is necessary that every path is equal. That will be so when the energy flow from any wave to its harmonics is proportional to the energy of the wave itself and proportional to some inverse power of that harmonic number as well. It doesn't matter which inverse power, the consequences are equivalent. This inverse power means that any harmonic mainly loses energy to its second harmonic with less to the third and rapidly diminishing amounts to the higher order harmonics. Such conditions are quite reasonable for a non-linear wave when the non-linearity is not very great. However under very extreme conditions of energy concentration there may need to be some additional elements added to this calculation.
This second look at harmonics generation keeps count of the number of ways in which each harmonic is formed. So as the ways in which the 4th harmonic is formed is found in the totals at the bottom of the table to be 2, that is fed back in at the side to its production of the 8th, 12th and 16th harmonics and so on.
2 3 4 5 6 7 8 9 10 11 12 13 14 15 16 ... 1 --> 1 1 1 1 1 1 1 1 1 1 1 1 1 1 1 ... 2 --> 1 1 1 1 1 1 1 3 --> 1 1 1 1 4 --> 2 2 2 5 --> 1 1 6 --> 3 7 --> 1 8 --> 4 ... etc Total 1 1 2 1 3 1 4 2 3 1 8 1 3 3 8 ... |
This little table shows the method of calculating how many ways each harmonic can be formed. Once the method is understood, computers can be used to do the same calculations for an extended range of numbers including very large harmonic numbers. Such calculations have been performed for numbers with 50 digits and more, but there is a practical limit because the number of calculations gets very great.
| Patterns in the Harmonics |
For each harmonic H, the number of ways that it can be formed is called C(H). When C(H) is calculated out for higher numbers some very clear patterns emerge. For the patterns to emerge it is first necessary to see that there are two effects going on that cause things to race off in opposite directions. By balancing these two things we can see the beautiful music of the universe.
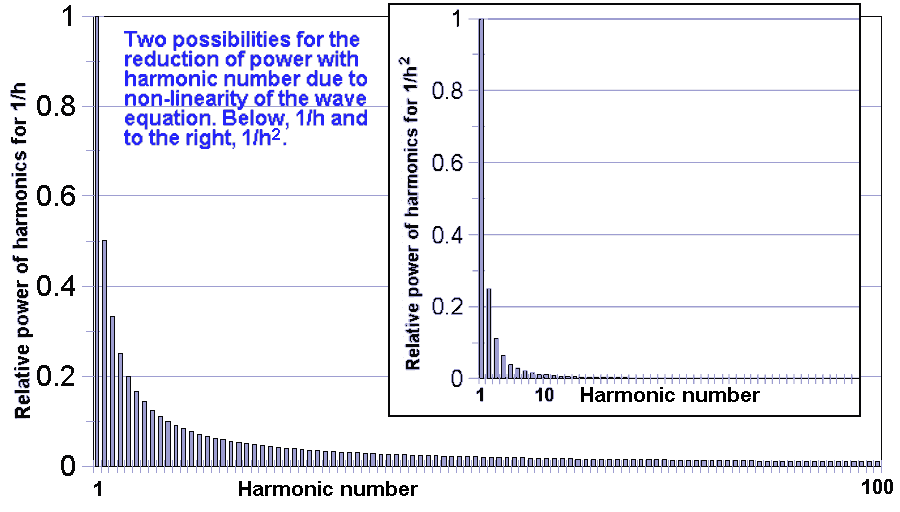
The first effect has been mentioned for non-linear systems, and that is that energy is lost to harmonics, mainly the low order harmonics. Such a pattern is shown in the figure below. In the theory we assume only that the power in each harmonic drops off as some inverse power of the harmonic number. It might be 1/H or 1/H^2 or 1/H^3 or even a non-integer number. In every case the result of going to higher order harmonics is a decrease in relative energy. But this recognises only one step in the process of making harmonics.
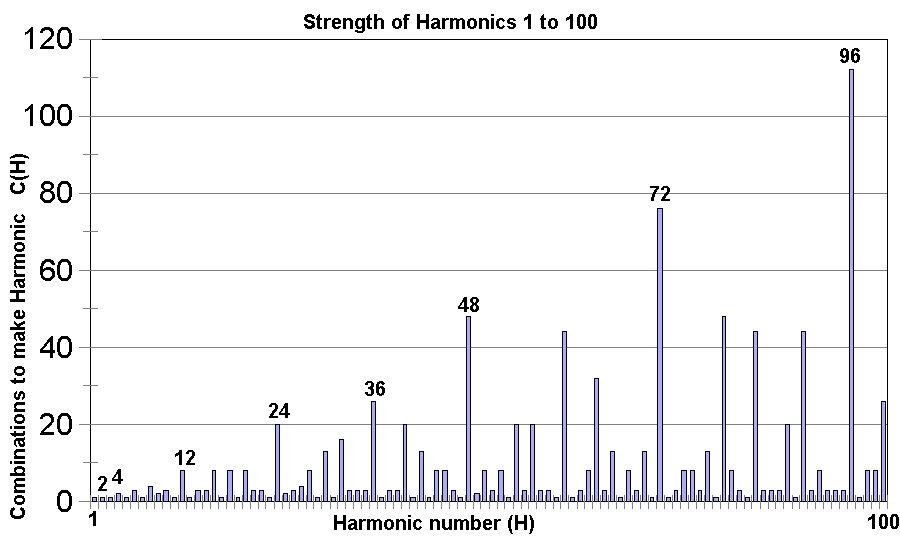
The second effect is that numbers that are able to be factorised in a larger numbers of ways tend to be higher numbers rather than lower ones. This effect is in the opposite direction to the other effect but does not exactly cancel it out. Not all larger numbers have many ways of being factorised, but the larger the number the greater the possibility as shown in the figure below.
What we are really interested is, in any range what are the strongest harmonics which means the ones that can be factorised in the greatest number of ways for the size of the numbers. These will be the waves with the most energy for their size and which will presumably show up to our senses or on scientific instruments in preference to their weaker neighbours. The above two effects are combined below for the first 100 harmonics by showing C(H)/H as a function of H.
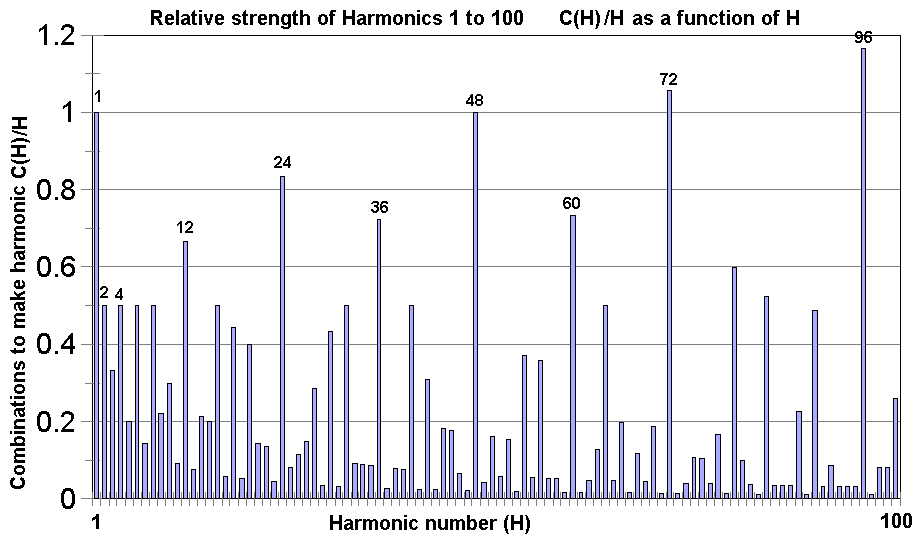
Although 1/H works well in this range for detrending the rapidly rising C(H), it does not work so well for much larger H and C(H). This issue will be returned to later. For now, let us observe some of the patterns that are present in the harmonics from 1 to 100.
Firstly we see that multiples of 12 make stronger harmonics than other numbers and that very strong harmonics always have other strong harmonics at ratios of 2 above and below. By this is meant that if H is very strong then H/2 and H*2 will also be strong.
Next we may notice that there is a very strong musical pattern present. In particular, looking at the interval from H=48 to H=96 the very strongest harmonics are 48-60-72-96 which is a major chord in music (usually known as the ratios 4:5:6:8 resulting when cancelled by factors of 12). In addition the notes of the just intonation music scale are exactly represented in the harmonics 48-54-60-64-72-80-90-96. Additionally two extra notes labelled here as Mi-flat and Ti-flat are quite strong. These are needed to make dominant seventh chords.
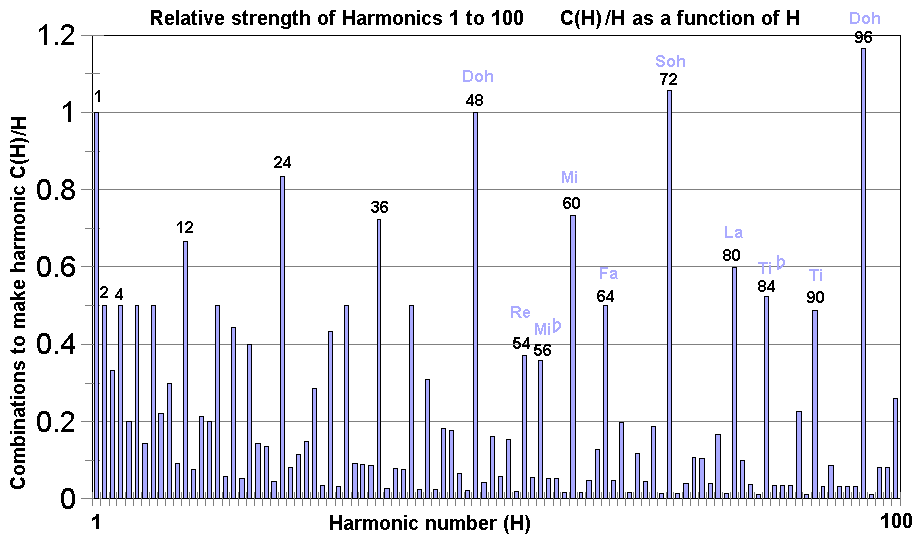
The reason that music and the strong harmonics are so closely related is that both are representations of frequencies which have as many small number ratios present as possible. As we look more deeply into these relationships we will see why past great scientists have referred to the music of the spheres. The underlying energetic frequencies of the universe have relationships that are everywhere musical, although as we go to higher numbers various different types of music are found and some of it would be rather foreign to our ears.
| Oustanding Harmonics |
To further delve into the pattern of the harmonics it is necessary to solve the problem of detrending the upward sweep of C(H) which grows ever faster with increasing H. For example, the harmonic 34560 has no less than 622592 ways of being factorised, so if it were placed on the graph of C(H)/H above it would be at 18.01... which is way out the top and past your ceiling. And further up there are numbers with 36 digits that have a number of ways of being factorised that has 57 digits so it would be more than out of the graph, it would be out past Sirius!
I might add as an aside that it takes a bit of computer time to calculate these harmonics. When I was doing this in the early days of the Harmonics theory I had this new fast computer with an 80286 chip in it that could calculate harmonics up to 15 digits or so if left alone for a few days. With the advance in computer speed and a few programming and mathematical tricks it is now possible to calculate beyond 50 digit harmonics. It doesn't do all of them, only the strong ones and the other ones necessary to calculate the strong ones.
In has taken some considerable effort to find a formula that detrends this sweeping growth. After using a variety of techniques to seperate the different parts of what is going on, in March 2004 a formula that fitted the trend in the strongest harmonics was found. It works reasonably well up to fifty digit harmonics but might require a little tinkering beyond there. The trend in C(H) for the outstanding harmonics is estimated as Cest(H) = (H^1.7323)/(10.18^sqrt(log10(H)). The following graphs have been detrended by dividing C(H) by this Cest(H). This leaves two other parts of the variations in C(H) untouched. They are the variations in C over several octaves of H, and the detailed patterns within the octaves.
The result of this detrending is that we are free to look for the effects that are visible to us in the energy patterns of the universe because we will be comparing the energy at similar scales and not trying to compare galaxies to atoms which is beyond the present scope.
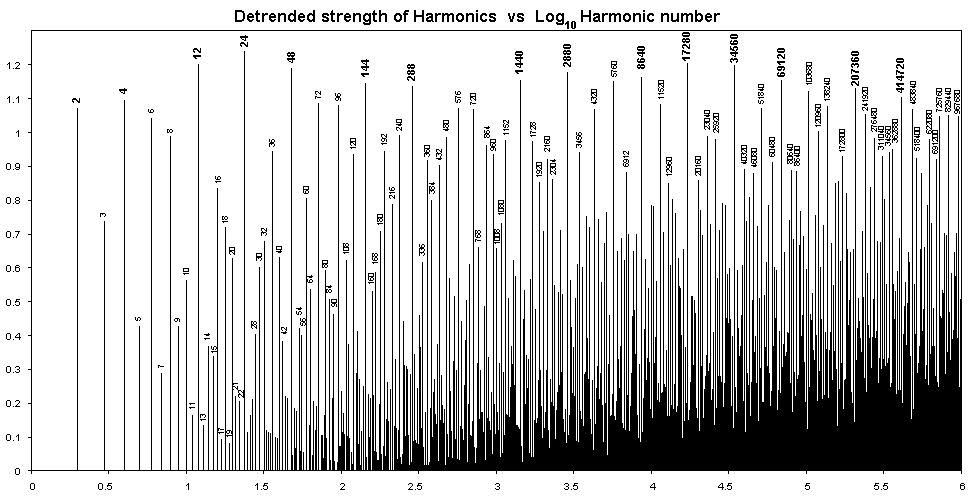
One other thing will be done to allow the musical pattern to be more easily seen, and that is to use a log scale for the harmonic number H, meaning that each doubling of H will take the same horizontal space. This will also avoid the graph going past Sirius in the horizontal direction. A doubling of H is what is called an octave in music, or going up from one note such as C to the next C. Now lets look at our harmonics in terms of whether they are outstanding harmonics in their range for harmonics from one to a million on a log scale.
It is clear that as the harmonic nember gets higher the complexity increases. The number of weak harmonics grows very rapidly and although the strong harmonics stand out very much from these weak ones they are much further apart. There is less complexity amoung the strongest harmonics, with ratios of 2, 3, 4, 6, 12 and 3/2, 4/3, 5/4, 9/8 and others being frequently present between strong harmonics. These are the musical ratios. This diagram is nothing more or less than an enormous chord spanning some 20 octaves and including within it all the commonly known musical chords and scales. This aspect will be examined in detail later.
| Main Line Harmonics |
The term "main line harmonics" is used for the harmonics shown in larger font in the above diagram. They are the series of harmonics starting from 1 that are always related to each other by a prime number ratio and which are the very strongest harmonics. There are some marginal cases to this definition as we might have chosen either 5760 or 8640 to lie between 2880 and 17280. Either way the ratios would be the primes 2, 3 or 3, 2 but 8640 was chosen as being a little stronger than 5760. Such a decision might be influenced by the formula for detrending the harmonics.
The purpose in highlighting these main line harmonics and the prime ratios between them is that the prime ratios contain a pattern which is almost regular. The early main line harmonics are 1, 2, 4, 12, 24, 48, 144, 288, 1440, 2880, 8640, 17280, 34560, 69120, 207360, 414720, ... and these have ratios between them of 2, 2, 3, 2, 2, 3, 2, 5, 2, 3, 2, 2, 2, 3, 2, ... and so on. It can be seen that there is one ratio of 3 for every two or three ratios of 2 and that the other primes occur much less often.
At one time I conjectured that the primes occurred with inverse frequency p*log(p) and because it it difficult to calculate very high harmonics this conjecture was used as a substitute for the actual calculations beyond the known limits. However with increasing computer speed and a few mathematical tricks it has been possible to calculate the harmonics out beyond 10^50 now and to find that the conjecture is not correct and gets gradually less accurate at higher order as the larger primes get further apart than expected. If this conjecture were correct, then a three would occur for every 2.38 twos, a five would occur for every 5.8 twos and a seven for every 9.8 twos. On that basis a 7 should be due to happen next and it does.
These proportions of 2s, 3s, 5s and 7s are quite consistent with musical practice. Pythagoras only used 2s and 3s in his musical scale, however Galilei, the father of the famous Galileo, showed that a major third is really 5/4 and not 81/64 as Pythagoras had assumed. Actually both of these ratios do occur but it is most often Galilei's ratio that happens in music. It has been expressed, for example by the mathematician Euler, that the ratio 7 is a bit too harsh to be used in musical ratios. However it is used in Indian music and in Blues music and should definitely be considered as a valid musical ratio, Part of the reason that it is not used more is not that it is naturally harsh but that it does not fit in with the present music notation which really is biased to the equitempered scale which only deals comfortably with ratios involving 2, 3 and 5. The proportional frequency of occurence of 2, 3, 5 and 7 according to the harmonics theory gives a meaningful answer to the question that Euler asked concerning the concordance of sounds, a subject which has been studied by music theoreticians since Euler's time.
| Families of Harmonics |
When several main line harmonics in a row are at ratios of 2 relative to each other, those families of harmonics do not stop just because they are not in the main line. For example, looking at 144 and 288 in the main line, we can trace a smooth curve back through 72, 36, 18 and 9 and forwards through 576, 1152, 2304 and further on into the weaker harmonics jungle. These harmonics that are linked by ratios of two are called families of harmonics and they can help us to see the fascinating structure present. In music all of the notes linked by ratios of two are given the same name such as C, although they may be called C4, C5 and C6 so that we know which C is meant. The families are just like the musical notes, and adjacent families, which are different by only a ratio of 3, are like the most common musical modulations of adding or taking away a sharp or flat in music.
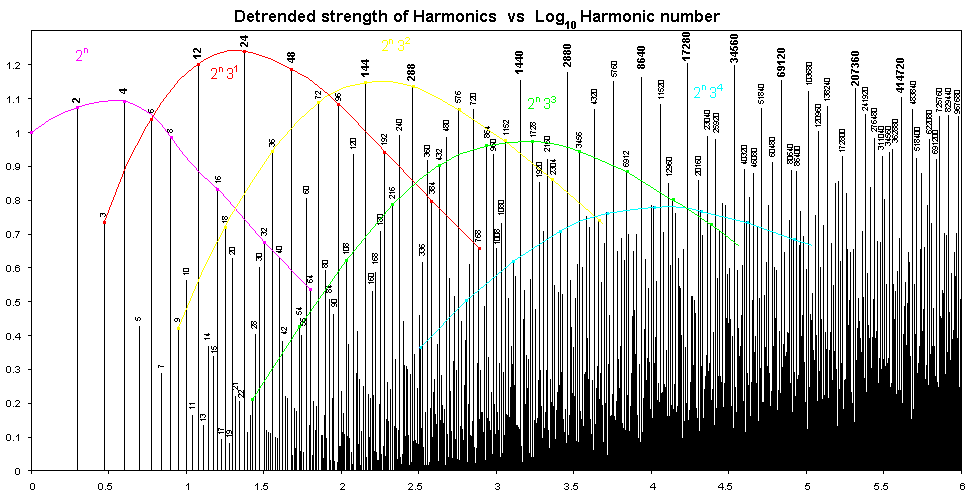
The first family goes 1, 2, 4, 8, 16, ... or just the powers of 2. Initially these are the strongest harmonics but at 8 the harmonics dip below the next family, their cousins, 3, 6, 12, 24, 48, 96, 192, ... which are all powers of two times 3. Again these are the strongest harmonics from 12 to 48 but then 96 falls below the line of the next family. This process keeps repeating with families that are powers of two times 3, 3^2, 3^3, 3^4 and so on. It can be seen that the peaks of these coloured parabolas occur between 12 and 24 then 144 and 288 and so on. This supports the view that a ratio of 3 happens for every 2.38 ratios of 2 because that also would fall between those same numbers.
However something else happens to our coloured lines as we move from left to right, the peaks of these parabolas are themselves making a parabola and as a result they stop being the highest harmonics of all. A new unmarked family of 720, 1440, 2880, 5760, ... takes over the lead. This family is of the form 2^n*3^2*5 and second cousin 5 has joined the fray.
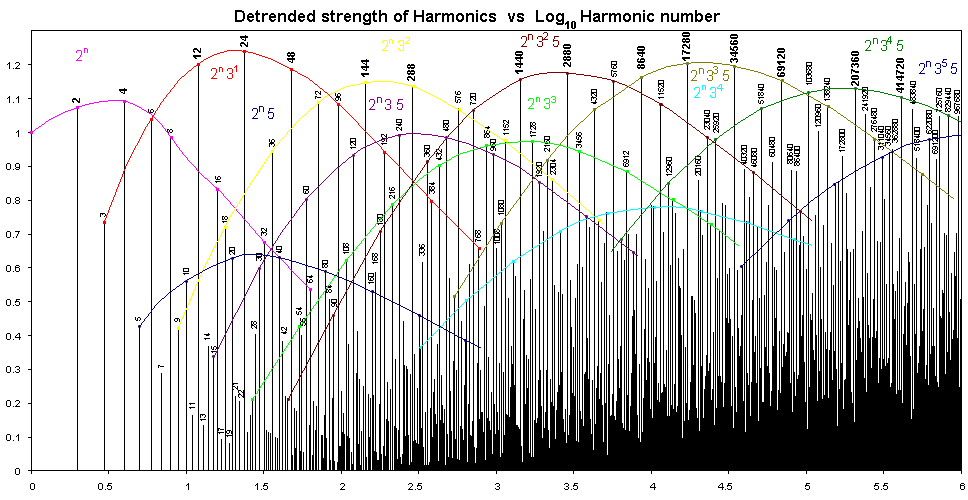
The curved lines are getting a bit more crowded now, so the new families, which all have a factor of 5, have been added in darker colours. These new families again each make parabolas and the cousin families again extend this with a parabola of parabolas. At the right edge of the graph some of the strong harmonics are not members of any of the coloured families, but belong to a new cousins involving the ratio 7.
It is possible to make parabolas through harmonics that are linked by ratios of 3 rather than 2 also. An example would be 16, 48, 144, 432, ... and many others. Such groups fall away a little faster in each direction than the families based on ratios of 2. If we do the same thing with ratios of 5 or 7 then they fall away faster still. That is why repeated ratios of 2 and 3 happen in music but not with the higher primes.
| Flow of Energy |
These patterns help to see what is going on as regards how strong or energetic each harmonic is and its relation to others, but they do not make clear why it happens. For an understanding of why this happens it is helpful to look at the flow of energy between harmonics as described in the harmonics axiom. Each harmonic loses energy to exact multiples of that harmonic.
The following diagram does not attempt to be an exact representation or to show every harmonic and every flow of energy, just the flows to multiples, 2, 3, 4, and 6. Remember that more energy flows to the lower harmonics, especially 2 times. The thickness of the blue lines is representative of the amount of energy flowing. Those harmonics with little input obviously must have corresponding output.
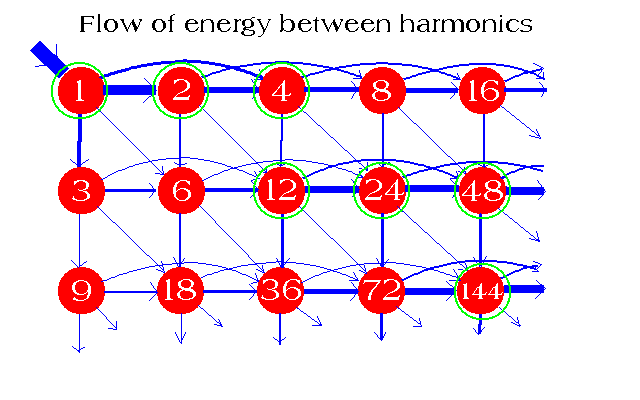
The diagram does show that even though energy is mostly lost from harmonic 1 along the first line and only a small proportion goes downwards, eventually that proportion accumulates because it never comes back upwards. So by the time we get to 8 the next line at 24 is already stronger. Further along the leakage has made the third line predominate and so on. The green circles show the strongest harmonics which are called the main line.
Remember that some energy is also going to ratios other than 2, 3, 4 and 6 as shown here. Some of these ratios are within the diagram such as 8, 12, 16, 24, 9 ... but the direction of travel of energy is always from left to right and top to bottom. The extra flows not shown include 5, 10, 15 and others with the ratio 5. To include these in the diagram we would need to include a third dimension, putting another layer below the first with harmonics 5 times higher and another with 25 times higher. Such a diagram would then show why eventually the families related by ratios of 3 also fall away, because the family with one ratio of 5 then takes over in the main line.
Between these different ways of looking at things it should now be clear that although the initial assumptions of the harmonics theory are extremely simple, the pattern of energy made by harmonic number, or frequency, is quite elaborate. The question to be ultimately asked is whether that elaborate pattern bears any relationship to the real world around us. If it doesn't then this exercise would still be interesting in terms of mathematics and music but would not have served its purpose which is to explain the structural scales at which the universe manifests energy.
Before looking at these relationships to the universe it is necessary to look at extremely large harmonics, going not just up to a million but through more than 170 octaves to numbers with over fifty digits in them. This is required because the scales of the universe that have been observed range from tens of billion light years down to around 10^-17 metres which is below the scale of naturally (at least in our little corner of the universe) occurring sub-atomic particles. The ratio between these extremes is about 10^43 and we cannot just assume that the largest scale so far observed is the size of the universe, because the distance that we have observed to keeps on going up over time.
| Really Big Numbers |
During March 2004 I decided to extend the harmonics calculations which I had done years before. Computers had got much faster since then and I put a little effort into speeding up the calculations by taking some additional mathematical shortcuts. The speed of calculation improvement can be broken into three steps, one of which was undertaken years ago in order to even do 15 digit numbers. If I had told my computer to lay out a table like the ones in the chapter "Many Harmonics" twelve years ago then it still wouldn't have completed the calculations that I did then. So what I did was recognising that numbers with lots of powers of 2 and less each of 3, 5 and 7 were present I made a different shaped table with just products of powers of these numbers. The first speed up in calculating the number of ways each number can be factorised is to discover this formula:
| H(C) = sum H(I) over all I that are factors of H, except H itself. |
An example is always worth a thousand words, so for example H(12) = H(1) + H(2) + H(3) + H(4) + H(6) which doesn't help us very much until we have calculated the smaller harmonics. We start with H(1)=1 not because 1 has any factors other than itself, but because if we don't nothing else works. Where harmonic one comes from is not part of the definition, it is an assumption that will no doubt lead to speculations about God and many other things.
We know that H(2) and H(3) are 1 because 2 and 3 are primes. H(4) is 2 because it is made from H(1) and H(2). H(6) is 3 because it gets a share of H(1), H(2) and H(3). So now we can add them up and get the answer H(12)=8.
When this process is done for number to 10^50 it requires 8 nested repeats for the eight primes 2, 3, 5, 7, 11, 13, 17 and 19 just to visit each number once, and another 8 nested repeats within those to add up all the harmonics that are the numbers factors. That adds up to a really big number.
In the latest runs I reduced the calculating time by incorporating two time saving factors. The first is to recognise that 2^8*3^3*5^1 can be factorised in the same number of ways as 2^3*3^8*5^1 and 2^8*3^1*5^3 and so on. So rather than calculate all of these, if the program finds a pattern of prime indices that it has done before in a different order then it takes a wee peak at the result and pretends it didn't copy off someone else. This doubled the speed of calculation.
The last improvement to speed was to see that when doing C(24) we get H(1) + H(2) + H(3) + H(4) + H(6) + H(8) + H(12) and that H(1) + H(2) + H(3) + H(4) + H(6) is already known and is the same as H(12) because that is how we calculated H(12). So H(24) is just 2*H(12) plus H(8). Now although this type of thing happens incredibly often in the calculations, it is extremely difficult to generalise how to do it. However I recognised one very common situtation which is when going up by a factor of 2 and just did that one. It improved the speed by a factor of ten and enabled me to calculate to beyond 10^50 which was a desired result.
The output of my 25th March calculation was a 463 MB tabulation. This is too big to share and not a lot of use on its own. So I make available on my website several files in CSV (Comma Seperated Values) format which is plain text numbers seperated by commas. It can be used as input to spreadsheets by anyone who wants to play around with these numbers and calculations. One file is the mainline harmonics which is quite a small file and another is harmonics selected for being strong in their range which is rather large because otherwise it is not a lot of use.
Here is a graphic showing all the stronger harmonics up to around 10^54. Notice that at the top end the pattern goes a little funny, which is due to incompleteness of my calculations in that vicinity. This graphic and the file are reasonably complete to around 10^51 for even moderately strong harmonics and complete for the strongest ones to 10^53.
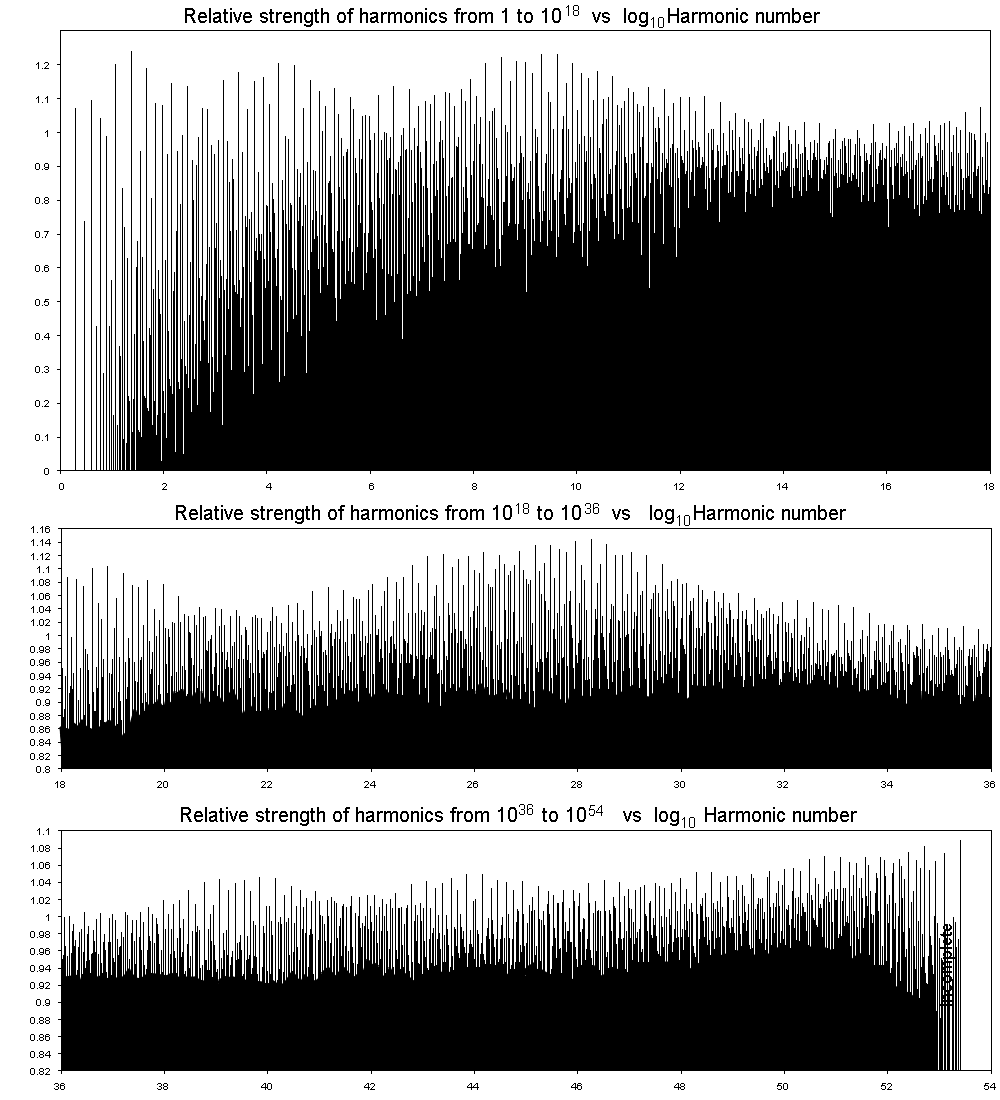
The parabolas showing the families of harmonics with ratios 2 are visible throughout the range 1 to 10^53 as are the other common musical relationships. However there are some other things going on too, most noticeably some general waveness in the main line harmonics. Given that a detrending formula has been used it is reasonable to ask to what extent this waviness is real and to what extent it is a product of the analysis. The answer is that the broad sweep of the graphs, which includes a slight upturn at the very high end, may be a result of the analysis. However the waviness on the scale of several powers of ten is most definitely a real thing although its exact measurement may be subject to some refinement yet. This is attested to by four different things.
Firstly, the detrending has only two terms which does not allow it to put so many curves in. Secondly, the very high peaks are always associated with places where the one family stands out strongly from any other families which means that the maximum energy flow is in that particular family at the peak. Thirdly, alternative detrending methods that take a less global perspective still show these peaks. Fourthly, and perhaps most importantly, the major peaks occur at the places with are furtherest away from the larger primes in the main line sequence.
This last reason makes sense, because if we are right on a large prime in the main line sequence, then the energy is split equally between two different families of harmonics and so none can stand out from the others. This may be understood in the "Flow of Energy" diagram where for harmonics around the vicinity of 6 and 8 the energy is taking different paths and they come together again at 24 making a big peak.
| Major and Secondary Scales |
The following graph is based on only the main line harmonics, which as well as being detrended have had an additional adjustment to increase the variations at high harmonic number and reduce them at low harmonic number. This adjustment is not strictly necessary, but there is a clear trend for the waves to get smaller as we go from small to large harmonics and the idea is simply to make a more common basis throughout.
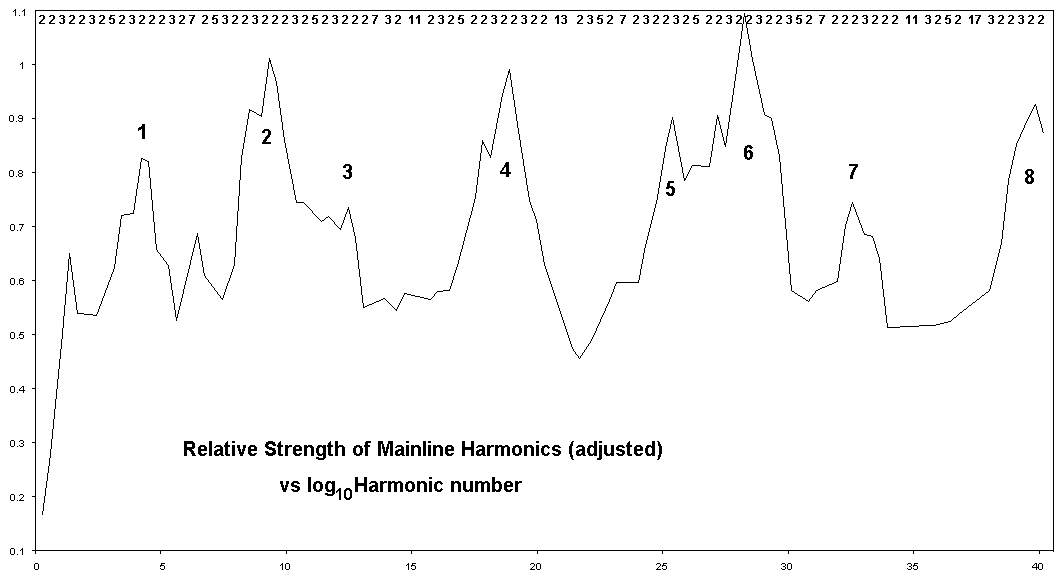
There are a series of major peaks at about 4.5 differences in log10(H) the first of which is the strong harmonic 34560 (and its mate 17280). Early in my harmonics studies (about 1993) I realised that these peaks occurred after each time the prime 5 appeared and that they were at ratios of about 34560 apart. It was also seen that secondary peaks happened after each ratio of 3 in the main line. To make these things clear, the main line harmonic ratios are shown along the top of the graph. Additional peaks and troughs are caused by the higher primes which largely determine the variations in the shapes and spacings of these fairly regular peaks.
| Observed Major Structure Scales |
When we observe the real universe there are a set of different structures that are at distance ratios of around 10^4.5 as the theory predicts. These structures are:
Hubble scale, Galaxies, Stars, Planets, Moons, X, Y, Z, Atoms, Nucleons, (quarks?)
The Z scale is associated with cells of the size of bacteria and is a common size for interstellar dust. I refer to the largest scale as the Hubble scale, or sometimes as the observable universe, but it should not be called the universe. Universe means everything and cosmologists agree that the universe may be larger than the presently observed scale. The scales labelled X and Y appear to be missing structures but the pattern continues beyond them in the same rhythm.
Here is a schematic which shows accurately the distance scales between occurrences of each type of object. The line is a crude representation of the relative strength of each type of energy formation with major scales shown in bold and related secondary scales not in bold.

The scale ratios of the major structures is very similar to the typical spacing of the theoretical prediction averaging 10^4.56 or 36000. The secondary peaks are at various ratios such as 12 between the spiral galaxy spacings and the small irregular galaxies, 14 between the gas giants and terrestrial planets and about 22 between the Hydrogen Bohr radius and the electron wavelength. The presence of various primes in these ratios may give clues to correct correspondence between the theoretical and observed patterns.
Although the major peaks are fairly regulary spaced, there are some a little wider and some a little narrower. The galaxy:star distance scale ratio is a bit larger and the planet:moon distance ratio a bit smaller. These characteristics do not fit the theoretical spacings if the Hubble scale is taken as the size of the universe. However if the Hubble scale is lined up with peak 2 then the spacings do correctly match.
| The Fundamental Cycle |
An even more definitive test is to compare the observed cycles in various ranges and the ratios between them, to the predicted prime ratios in the main line harmonics. In particular the ratios 11, 13 and 17 occur sufficiently rarely to afford a correct match should they be found in actual cycles periods or distance ratios. Such a test establishes without doubt that the universe is much bigger than the Hubble scale with the most likely estimate being 10^13 times bigger. In the scientific age, no measurement of such large scales has been possible before. However it does continue an established trend of the estimated size of the universe increasing in leaps and bounds from century to century.
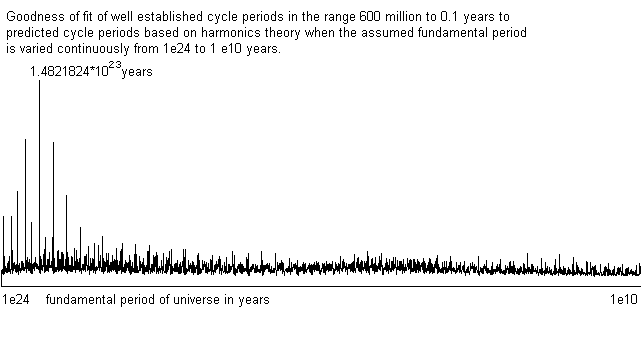
The above graph shows the result of comparing many cycles with accurately known periods in the range of 600 million years down to about a month to the pattern of predicted harmonics when various different values for the fundamental cycle are tested. The Hubble scale is near the extreme right and values were tested continuously throught to 10^24 years. A series of peaks, all far more significant than any others, appear centred on 1.4821824*10^23 years. The reason for the multiple peaks is that the harmonics are very similar when displaced by a factor of 2 and quite similar at factors of 3, 4, 6 and 3/2.
Using this 1.482*10^23 year fundamental oscillation period of the universe as a starting point and the harmonics theory as a basis, it is possible to determine the entire energy distribution of the universe as both cycle periods and distance scales. The distance scales are closely related to the time periods, being the distance that light will travel in that time. It will be seen that there are many matches between the distances and the periods, something that is aided by using light years for distances because they are then directly comparable to the years used for cycles. When the astronomers favoured units of parsecs are used the matches are not obvious to the unaided human eye.
In these longer cycle periods, there are sufficient cycles measurements from astronomy, geology, paleontology, climatology and economics to make linkages of small number ratios all the way from 600 million years down to a month. Below the period of a month, there are a number of gaps with a number of regions of known linkages alternating, and it has not been possible to fully establish the linkages. There are interesting clues with the ratios 11, 17 and 19 in the theory and observations of such ratios in nature, but although these ratios occur in the correct order, the spacings do not match correctly. This discrepancy is an indication that one of the assumptions made at the beginning of the calculations was slightly wrong and will require further study to determine the necessary corrections. This work needs to involve both mathematicians and physicists.
| Commonly Reported Cycles |
The following table shows commonly reported cycles periods that are linked by exact prime number ratios and includes many accurately measured cycle periods. The table has ratios of 2 horizontally and 3 vertically, except where larger prime ratios are shown on the right side.
(millions of years)
586.24  293.12  146.56   73.28   36.64
                                                                 (11)
 53.294  26.647  13.324
                  4.4412  2.2206  1.1103
                                                                  (5)
                          0.44412 0.22206 0.11103 0.05552

(years)
55520  27760
        9253   4626   2313   1157
        3084   1542    771.0
        1028    514
                171.3
                                                                 (13)
 4270   2135   1068    533.8
         711.7  355.9  177.9   88.97  44.48  22.24  11.12
                        59.31  29.66  14.83   7.414
                        19.77   9.885  4.943
                                                                  (5)
         427.0  213.5  106.8   53.38  26.69
         142.3   71.17  35.59  17.79   8.897  4.448  2.224
                 23.72  11.86   5.931  2.966  1.483  0.7414
                  7.908  3.954  1.977   .9885  .4943  .2471
                                 .6590  .3295  .1648  .08238
                                                                  (7)
                  3.389  1.695   .8473  .4237  .2118
                          .5649  .2824  .1412  .07061 .03530 .01765
|
Specific cycles reported from different disciplines are:
586.24 MY - Geology - S Afanasiev
~600, ~300, ~150, 74 and 37 MY - Geology - G Williams et al
80.0, 53.3, 26.65 MY - Paleontology: Mass extinctions
2.22 MLY - Astronomy - Andromeda distance
1.11 MY - Astronomy - Solar system energy exchange
0.111, 0.0555 MY - Astronomy - Solar system dynamics
4600, 2300 Y - Climatology, Solar(?) - H H Lamb
4634, 2317, 771 Y - Astronomy - Outer planet alignments
~1000, 510, 170 Y - Weather etc - R Wheeler
355 - Historical and other - Chizhevski et al
178 - Astronomy - Outer planet dynamics, Sunspots(?)
143, 53, 22.0, 17.7, 11.2, 9.6, 6.0 Y - Wars - Chizhevski
8.9, 4.45 Y - Economics - Recessions
11.86 Y - Astronomy - Jupiter's orbital period
5.93 Y - Commodities
3.390 Y - US Stock market - E Dewey, R Mogey
1.695 Y - Commodities
154-155, 77 d = 0.423, 0.211 Y - Astronomy - Solar Corona
25.8 d = 0.0706 Y - Astronomy - Solar rotation
See also table of Ed Dewey cycles.
| Origin of the Harmonics Theory |
The Harmonics theory came about through the study of cycles. The first four common cycles that I found were almost exact fractions of 35.6 years, being 1/4, 1/5, 1/6 and 1/8 of that figure. The following figure shows the discovered cycles periods and the arrows are at exact fractions of 35.6 years. These cycles existed in the New Zealand economy, but later I was to find that they also existed throughout the world and even beyond. Other cycles that I found were also fractions of 35.6 years.
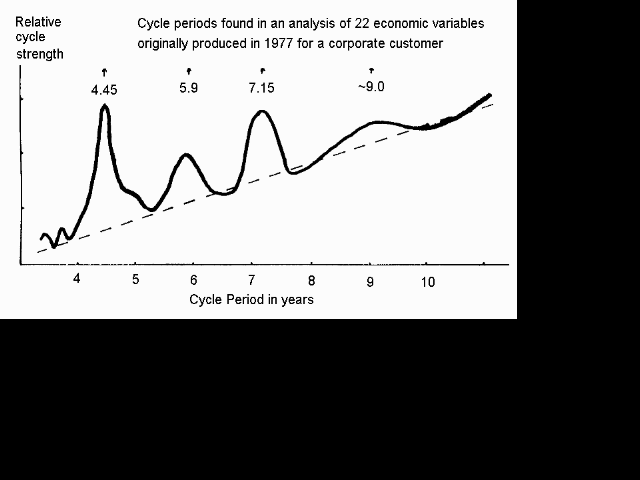
When I discovered a whole set of cycles in 44 years of weekly corn prices I realised that they had frequencies that were in exactly the same ratios as the white notes on the piano plus two black notes (Eb and Bb). Then I noticed that the 4:5:6:8 frequency of the original cycles was a major chord in music. At the time this was altogethr too weird - was God playing major chords in the NZ economy and scales in corn prices? I didn't mention it to people because it seemed that I would get laughed at. Then in the mid to late 1980s I found out that there was a place called the Foundation for the Study of Cycles and paid them a visit in the USA. What I found was that quite a few things that I though I had discovered were already known to Dewey and other researchers. Partly I was upset because my "discoveries" were not original, but partly the confirmations assured me that what I had found was very real and very pervasive, because Dewey studies different time series from different countries and even over different time intervals.
Ed Dewey, who formed the Foundation for the Study of Cycles made a life long study of cycles in everything that he could. After producing, collecting and colating several thousand reports of cycles he reached a number of conclusions. They were:
|
1. Everything studied by man that can be made into a time series has cycles in it. 2. There are common cycles periods that exist in many seemingly unrelated fields of study. 3. These cycles with common periods exhibit cycle synchrony, meaning that they reach their peaks and troughs at the same time. 4. Many of the commonly reported cycles exhibit simple ratios of 2 and 3 (and their products) between them. 5. Some of the observed cycles that fit these patterns are outside the earth.
|
Dewey's table of common cycle periods in years showing ratios of 2 and 3.
142.0  213.9  319.5  479.3
-----
    71.0  106.5  159.8
          -----
        35.5   53.3                 x2      x3
        ----   ----                   \    /
           17.75                       \  /
           -----
         5.92   8.88
         ----   ----                   /  \
    1.97    2.96   4.44               /    \
    ----    ----   ----             /3      /2
  0.66   0.99   1.48   2.22
  ----   ----   ----
0.22  0.33  0.49   0.74  1.11
      ----  ----   ----  ----
Underlined figures are commonly occurring cycles.
|
Many of these conclusions reached by Dewey have also been reached by other researchers not aware of each other's work. I was one, and earlier there had been at least 3 or 4 others who found the musical scales or the ratios of 2 and 3 which amounts to the same thing. Here in Dewey's table was 35.5 years, very close to my 35.6 years, and this single table had 3 of the 4 cycles that I had found. Dewey had also found the other one, but it did not fit into this table.
I had, like Dewey and others, only gradually come to the understanding that these cycles arrive from outside the earth. Not only that, but quite a few of them fitted with planetary alignments, and many serious scientists or analysts do not want to go there because that is astrology and only quacks do astrology. However it is a fact that these relationships exist. There are several reasons why the planetary alignments match common cycle periods, and others why the Sun is affected by planetary alignments. Saying that does not make me an astrologer. Like many scientists I regard horoscopes as as a cruel trick played on gullible people.
| No Big Bang |
Although the Harmonics theory was described above in terms of the non-linearity of standard physics wave equations, that is not how it was discovered. That was the result of trying connect an already successful theory with the prevailing scientific view. In that prevailing view there was one thing that was entirely unacceptable to the Harmonics theory reconciling with accepted physics, and that was the Big Bang theory. The Harmonics theory logically follows from Maxwell's equations and General Relativity but requires that the universe must be much older than Big Bang cosmology and have continuous wave communication between its parts to gradually develop harmonics over many cycles of oscillation of even large scales such as the Hubble scale. That is, the Harmonics theory is an oscillating universe theory, a view that has been flirted with by cosmologists at times. Also, the Harmonics theory is very clear in the order of formation from the top down and not the bottom up. This easily explains the large scale structure in the universe such as the very clear galactic supercluster scale which, although very clearly observed, is largely swept under the carpet in Big Bang circles because it just does not fit with the theory.
"Experiment and observation are the judges in science, the only problem is that not everyone understands the verdict"
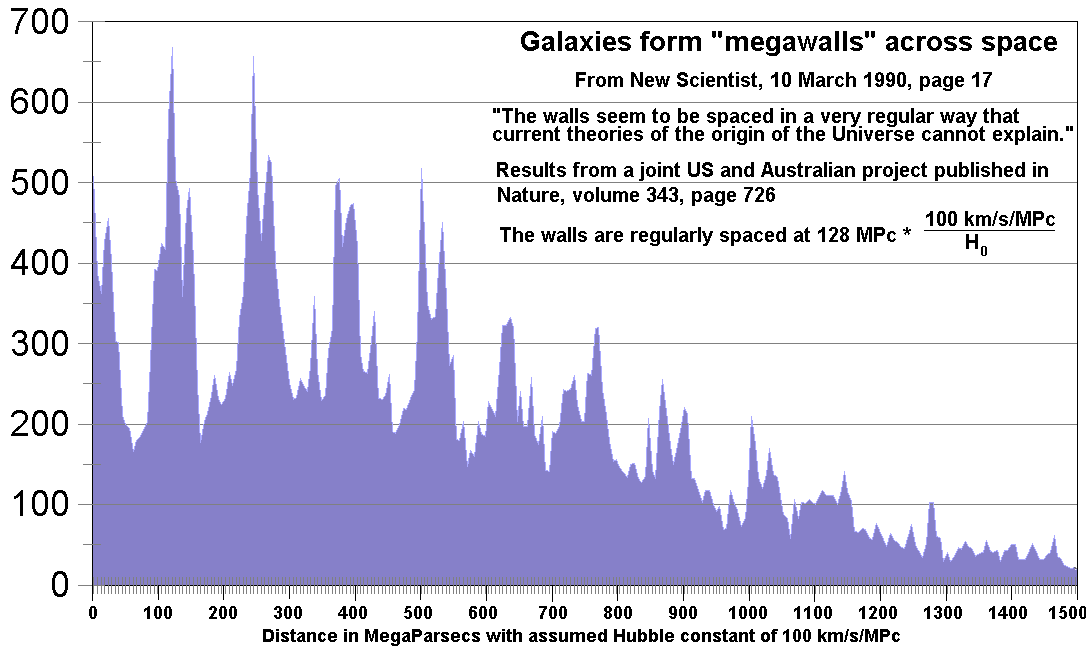
Here is one of a number of cosmological studies that show that galactic superclusters exist at regularly spaced intervals. The quote from New Scientist in the graphic is no longer correct, there is a theory that expected not only that such structures existed but correctly predicted the spacings. That theory is the Harmonics theory, and it links these large structures with huge waves in the universe and the period of waves of just this size are found as one of the strongest geological cycles periods. Because that cycles period is known accurately it allows the accurate determination of the Hubble constant, something not yet achieved by "existing theories".
Mountain Man has been a great supporter of Harmonics theory and has also replicated much of the calculations of the theory to confirm that they are indeed accurate. Not only that he discovered that the calculation was already known as "the number of ordered factorisations" in mathematical literature. Please see his pages on this also:
Number of Ordered Factorisations - Resource Index
Number of Ordered Factorisations - some calculations
Thank you Mountain Man. Your support in so many ways has been much appreciated.